
Maintenance budgets built on gut instinct tend to fail at the worst moments. Many property managers set a rough percentage, apply it across the board, and then watch it unravel the first time an HVAC system fails or a roof starts leaking mid-winter. The result is either chronic underfunding that quietly erodes property value, or reactive overspending that wrecks cash flow projections. This article breaks down evidence-backed budgeting frameworks, practical benchmarks, and operational controls that help property management teams build maintenance budgets they can actually rely on, portfolio-wide.
Table of Contents
-
Why maintenance cost budgeting matters for property managers
-
Our perspective: Why most landlord budgeting fails and how to build resilience
Key Takeaways
| Point | Details |
|---|---|
| Benchmark with real data | Use historical spending and property-specific benchmarks instead of relying only on general percentages. |
| Prioritize workflow controls | Proactive scheduling, bundling, and vendor management keep budgets stable and emergencies rare. |
| Separate OPEX and CapEx | Track routine maintenance separately from capital improvements to avoid budget shortfalls. |
| Avoid underfunding pitfalls | Too-low budgets often defer repairs, costing more in the long run. |
| Review and adjust regularly | Routinely reassess your budgets based on work-order data and actual expenses for best results. |
Why maintenance cost budgeting matters for property managers
Maintenance budgeting is not just a financial exercise. It is a core operational discipline that directly shapes cash flow, asset value, and tenant satisfaction. When budgets are too thin, repairs get deferred. When they are too generous without structure, money disappears into reactive fixes that could have been prevented. Either way, the property owner and the management company lose.
Deferred maintenance is particularly damaging. A $200 plumbing fix ignored for six months can become a $4,000 water damage remediation job. That pattern, repeated across dozens of units, can collapse net operating income (NOI) and trigger costly insurance claims. For property managers responsible for scaling property maintenance operations across growing portfolios, the financial stakes compound quickly.
The operational reality is that budgeting for maintenance requires more than picking a reserve percentage. It requires visibility into work-order patterns, vendor performance, and property-specific risk factors. As one industry framework puts it:
“Budgeting for maintenance is as much about operational controls (preventive schedules, work-order workflow, vendor coordination, and bundling) as it is about picking a reserve percentage; reducing preventable emergencies is a direct cost-control mechanism.”
Key reasons why maintenance budgeting deserves serious operational attention:
-
Cash flow stability: Predictable maintenance spending prevents surprise draws on reserves or emergency credit lines.
-
Asset preservation: Consistent upkeep protects property values and reduces long-term capital expenditure.
-
Tenant retention: Well-maintained properties reduce turnover, which is one of the most expensive line items in property management.
-
Regulatory compliance: Many jurisdictions require habitability standards that demand timely repairs, making underfunded budgets a legal liability.
With the stakes established, we can dive into what traditional rules recommend and why they matter.
Rules of thumb and benchmarks: How much should you budget?
Most property managers encounter the same handful of rules when they first start building maintenance budgets. These models are useful starting points, but each has real limitations that become more apparent as portfolios grow or age.
The percentage-of-rent model is the most widely cited. A common landlord rule of thumb is to budget maintenance reserves as a percentage of rent, often around 5% to 10% of annual rental income. A property generating $24,000 per year in rent would carry a maintenance reserve of $1,200 to $2,400. This model is easy to apply and scales naturally with rental income, but it breaks down when rents are high relative to property age or condition.
The percentage-of-value model ties reserves to the property’s current market value, typically 1% to 2% annually. A $300,000 property would carry a $3,000 to $6,000 annual reserve. This approach better accounts for replacement costs but can overstate reserves in high-value markets where rents are proportionally low.
The cost-per-door model is increasingly favored for multifamily portfolios. On large multifamily portfolios, cost-per-door framing can be more actionable than broad rules of thumb. Empirical work-order analysis across 680,000 or more work orders shows a median annual repair cost of approximately $4,000 per property across major and secondary single-family rental markets. That number gives portfolio managers a concrete per-unit baseline to test against their own actuals.
| Model | Best for | Limitation |
|---|---|---|
| 5%–10% of annual rent | Single-family, simple portfolios | Breaks down with low rents or older assets |
| 1%–2% of property value | Mid-size portfolios | Overestimates in high-value markets |
| Cost-per-door ($4,000 median) | Multifamily, large SFR portfolios | Needs adjustment for local labor costs |
Pro Tip: Run all three models against your actual historical spend for the past two years. If your actuals consistently exceed one model’s output, that model is underserving your portfolio. Use the highest result as your floor, not your ceiling.
The real problem with all three models is that they are static. They do not account for property age, deferred maintenance backlogs, local vendor pricing, or seasonal demand spikes. A 20-year-old apartment complex in a cold climate will consistently outspend a 5-year-old complex in a mild market, regardless of what any formula says. Addressing your maintenance backlog strategies before applying any benchmark is essential to getting accurate numbers.
If you want to understand how reducing maintenance costs affects your overall portfolio performance, running a quick estimate through a maintenance ROI calculator can help you quantify the gap between current spend and optimized spend.
Operational controls that keep budgets predictable
After you have set a real-world budget, the next move is managing day-to-day operations so your costs stay stable and avoid nasty surprises. The most effective cost controls are not financial instruments. They are operational systems.
Preventive maintenance is the most powerful lever available. Scheduling routine inspections, HVAC filter changes, gutter cleanings, and appliance checks on a calendar basis catches small problems before they escalate. A $150 annual furnace tune-up prevents a $2,500 emergency call in January. Preventive maintenance and workflow controls, including bundling work and rapid vendor response, are operational levers that stabilize maintenance costs and reduce emergency spend.
Here is a practical sequence for building operational controls into your maintenance program:
-
Create a preventive maintenance calendar organized by unit, building system, and season. Include HVAC, plumbing, roofing, electrical panels, and common areas.
-
Bundle work orders by location and vendor. Sending one technician to handle three units in the same building on the same day eliminates redundant trip fees and reduces idle time.
-
Set response time standards by priority level. Emergency issues (no heat, flooding) should trigger vendor dispatch within two hours. Non-urgent issues should have a 24 to 48-hour acknowledgment window.
-
Track every work order from intake to close. Without data, you cannot identify patterns, recurring failures, or underperforming vendors.
-
Review vendor invoices against scope of work. Billing errors and scope creep are common in maintenance and easy to miss without systematic review.
Pro Tip: If your team is manually coordinating vendor scheduling through phone calls and emails, you are losing hours every week to tasks that can be automated. Streamlining your maintenance workflow through structured intake and automated dispatch can cut coordination time significantly without adding headcount.
Strong vendor management systems also play a direct role in cost control. Vendors who know they are being tracked on response time and invoice accuracy tend to perform better. Maintaining a vetted vendor network with pre-negotiated rates removes the pressure of finding contractors during emergencies, when pricing is always higher.
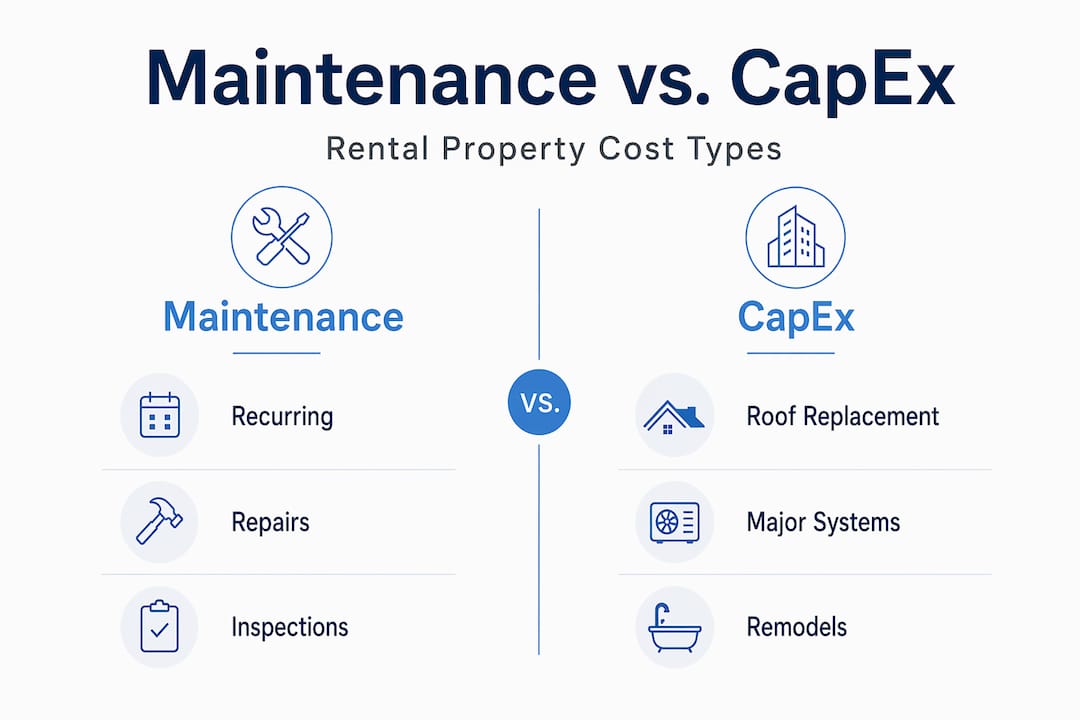
Segmenting maintenance vs. capital expenditures (CapEx)
Even with proactive controls, understanding what actually counts as maintenance and what does not prevents costly surprises and budget errors. This distinction matters more than most property managers realize.
Routine maintenance covers recurring, operational expenses: replacing a faucet washer, patching drywall, servicing an HVAC unit, or fixing a broken door lock. These are OPEX items, expensed in the year they occur.
Capital expenditures are major improvements or replacements that extend the useful life of the property: a new roof, HVAC system replacement, full kitchen renovation, or parking lot resurfacing. These are capitalized over time and require separate reserve funding.
Maintenance budgeting should separate recurring OPEX from CapEx and avoid expense ratios that are too low, which often signal deferred maintenance.
| Category | Examples | Budget treatment |
|---|---|---|
| Routine maintenance (OPEX) | Plumbing repairs, painting, appliance servicing | Annual operating budget |
| Capital expenditures (CapEx) | Roof replacement, HVAC system, major renovation | Separate reserve fund |
| Turnover costs | Cleaning, repainting, minor repairs between tenants | Operating budget, tracked separately |
Risks of blending these categories or underfunding either one:
-
Deferred repairs accumulate: Small issues become structural problems when OPEX budgets are too thin.
-
Asset deterioration: Properties that skip CapEx reserves face sudden, large capital calls that owners are not prepared for.
-
Compliance exposure: Habitability violations often stem from deferred maintenance, not capital projects.
-
Misleading financials: Blended budgets make it impossible to accurately assess maintenance expense reduction efforts or true operating performance.
A budget that looks lean on paper may actually represent a growing pile of deferred work. That is a liability, not an efficiency.
Applying budgeting strategies: A step-by-step checklist
To make these principles work for your unique properties, here is a concrete checklist to operationalize everything discussed so far.
-
Gather two to three years of historical maintenance costs broken down by property, system, and issue type. This is your baseline.
-
Separate OPEX from CapEx in your historical data. If they have been blended, do the work to untangle them now.
-
Apply all three benchmark models (percentage of rent, percentage of value, cost-per-door) and compare them against your actuals.
-
Adjust for property age and condition. Properties over 20 years old typically run 25% to 40% higher than median benchmarks. Factor that in explicitly.
-
Build in a preventive maintenance line item separate from reactive repairs. This makes it easier to track whether prevention is actually reducing emergency costs over time.
-
Set a CapEx reserve schedule based on the remaining useful life of major systems (roof, HVAC, plumbing, electrical).
-
Review actuals against budget quarterly, not annually. Quarterly reviews allow you to catch drift early and adjust vendor behavior or scheduling before costs compound.
-
Use work-order analytics to refine next year’s budget. Volume by category, average cost per issue type, and repeat-failure rates are the most useful signals.
Pro Tip: If you are automating maintenance workflows inside platforms like AppFolio, Buildium, or Yardi, the data you need for step eight is already being generated. The key is building a reporting habit around it so the data actually informs decisions.
As one industry source notes, “too-low” maintenance budgets can be worse than too-high ones because they often represent deferred repairs that later surface as larger, more expensive jobs. Testing your budget against property age and historical work-order patterns is not optional. It is the most important validation step in the process.
Our perspective: Why most landlord budgeting fails and how to build resilience
Having covered the tactical details, it is worth reflecting on where traditional approaches come up short and what the best operators do differently.
Most property managers treat maintenance budgeting as a numbers exercise. Pick a percentage, apply it to the portfolio, and move on. The problem is that the percentage is only as good as the operational system behind it. A well-funded budget managed through reactive, disorganized workflows will still produce unpredictable costs. The money gets spent, just not efficiently.
The operators who consistently control maintenance costs are not the ones with the most conservative budgets. They are the ones with the most disciplined processes. They bundle work orders. They track vendor performance. They run preventive schedules without skipping quarters. They review actuals monthly and adjust before problems compound.
There is also a troubling pattern in how budgets get set and forgotten. A property manager builds a budget in January, applies it across the portfolio, and revisits it twelve months later when the numbers do not match. By then, the damage is done. Deferred repairs have accumulated. Vendor relationships have drifted. Emergency spend has spiked.
The better approach treats the budget as a living document, updated by real work-order data throughout the year. This is exactly where AI-powered operational tools change the equation. When intake, triage, scheduling, and follow-up are handled systematically, the data generated is accurate, complete, and actionable. You stop guessing and start managing with evidence.
Resilient property management puts proactive, operational systems above simple percentage benchmarks. The budget is the target. The workflow is what gets you there.
Ready to modernize maintenance budgeting?
If the frameworks in this article make sense but the execution still feels manual and reactive, that gap is exactly what WiseUnit AI is built to close.
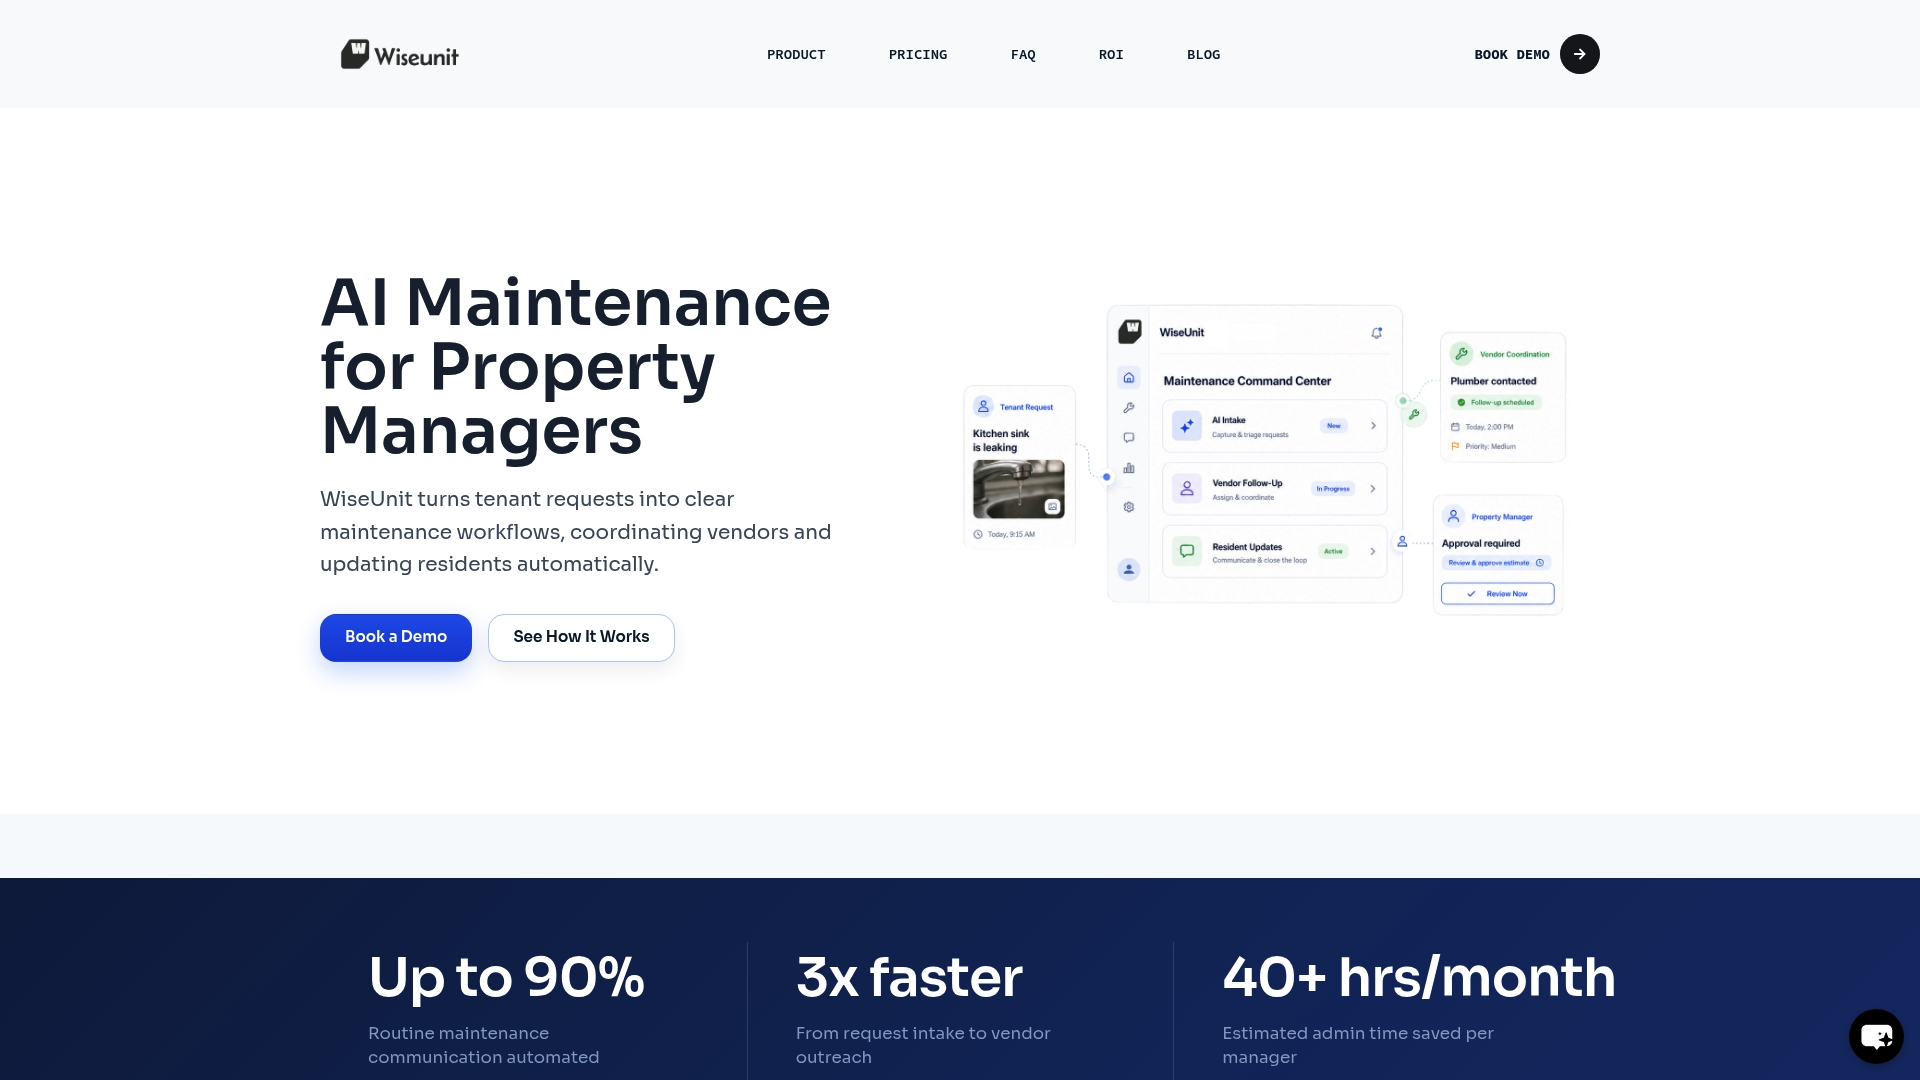
WiseUnit AI acts as the operational layer between your team and your maintenance workflows. From tenant intake through vendor dispatch, scheduling, and status updates inside your property management platform, every step is coordinated automatically. That means cleaner data, faster response times, and a budget that reflects what is actually happening in your portfolio. Start for free and see how much time your team reclaims in the first week. Or run your numbers through the ROI calculator to see the financial case before committing to anything.
Frequently asked questions
What is the ideal maintenance budget percentage for single-family rentals?
A common rule of thumb suggests 5% to 10% of annual rental income, but the right number depends heavily on property age, condition, and local labor costs.
How do you adjust for older properties or larger portfolios?
For aging assets or large multifamily portfolios, cost-per-unit analysis grounded in historical work-order data gives you far more precision than any broad percentage rule.
Why is separating CapEx from maintenance expenses important?
Blending the two categories masks deferred maintenance and distorts operating performance; tracking them separately, as recommended by multifamily expense guidelines, keeps financial planning accurate and defensible.
How can workflow automation help cut maintenance costs?
Automated workflows that handle bundling, rapid dispatch, and work-order tracking reduce emergency spend by catching issues earlier and eliminating the coordination gaps that drive up reactive repair costs.
What risks come from underfunding maintenance?
Underfunded maintenance budgets typically signal deferred repairs in progress, which surface later as significantly more expensive jobs and accelerate asset deterioration.